Graphing Templates
Check out the range of graphing templates we offer.

You can download the templates below to record and graph your data.
Save the file to your computer to enter your data. Graphs are automatically created with the data you enter.
Instructions for each template are provided on the instructions tab included in each file. You can also watch the instructional video to learn more about the graphing templates.
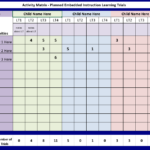
Activity_Matrix_Data_Recorder – this template allows you to create and print an activity matrix that can then be used to record data about implemented and complete learning trials. Data graphs will populate with the information you provide in the activity matrix forms.

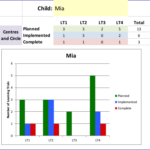
PIC_EI_Trials_Summary – this template allows you to record summary information about Planned, Implemented, and Complete learning trials and see bar graphs of your data.

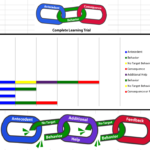
A-B-C-Data-Graph– this template allows you enter data about the component parts of implemented embedded instruction learning trials to see how many of learning trials are complete learning trials. Data graphs use color codes to show the component parts of the trials you’ve implemented.

Child_Data_Graphs– this template allows you enter a range of child data including frequency, accuracy, and level of support. View a line graph for frequency data, bar graph for accuracy data, and pie chart for level of support data.

Watch this short instructional video for using the graphing templates and learn more about the different types of child outcome and teacher implementation data you can graph.

